Facebook Advertising / Marketing: Best Metrics, ROI, Business Value:

Facebook has an incredible audience, 950 million strong and counting. This audience is immensely attractive to Brands and Marketers around the world. We've seen explosive growth in brand pages, types of advertising and other fun ways to monetize this audience.
Increased investment in Facebook as an engagement/acquisition channel has translated into requests from CEOs, CMOs and other CxOs about the return on that investment. As Facebook is a very young channel, it is not surprising that everyone's struggling with the answer.
This point was vividly illustrated at a session I attended at a major industry conference.
A Facebook employee (FBe) gave a talk about measuring ROI/Value of Facebook campaigns. FBe's recommendation was (paraphrasing a 35 min talk):
Don't invent new metrics, use online versions of Reach and GRPs to measure success. The value of Facebook in "spreading word of mouth," "getting your brand in front of friends of fans," and "engaging fans with five to seven posts a week on your fan page."
They closed with the Facebook Insights tool (which is quite nice). This blog post is about the above recommendations, and their merit. But first let's punch up the value you'll get from this post.
In the second part of the talk a large client joined FBe on stage to make the case for Facebook campaigns.
Here's a summary of the case study presented:
1. Client posted a video of a soon to be released product on their Facebook brand page. It is a lovely emotional video (really was!).
2. That video got a magnificent number of Likes.
3. Client also runs Facebook Promoted Ads for that post. Gets more Likes.
4. ROI? It was huge. The new product became the number one selling product in the company's history in that country.
5. Facebook works.
The case study seemed to contain a rookie mistake.
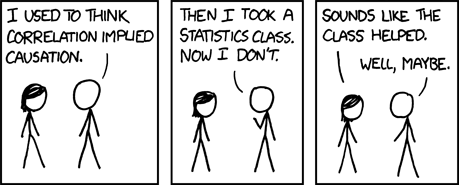
I can see the correlation, but the conclusion implies a causality that may or may not be there ("the product sales exceeded all internal projections!").
There are two valuable lessons we can learn from the above story.
Lesson 1:
Correlations don't imply causality.
Completely ignore the question of whether Facebook works (assume we are taking about Ren Ren or Google+). Focus on the fact that this was the launch of a powerful new new product via a continent-wide rebranding campaign using massive online and offline media buys.
A push on Facebook was a part of that effort.
So to imply the ROI in Step 4 is sub-optimal.
From the data presented, there is no way to tell if the Facebook campaign worked or not. Even if there were millions of Likes on the post with the deeply emotional video about the new product.
Lesson 2:
It would have been easy to identify causality, even if it was weak causality.
The Client could still do massive media buys (TV! Radio! Newspapers! Google!) in all countries in continent A. But they could also only make a major push with Facebook in country X.
Then, they could look at sales in all the countries including country X and a couple of other countries (Y, Z, A) that are similar to country X in terms of type of population, existing brand awareness, market penetration, competitive structures. This is a massive continent with lots of countries, should not be hard to do.
From that analysis, they could identify the incremental sales in country X compared to Y, Z and A. Attribute it all to the Facebook campaigns.
Compute ROI: (cost of Facebook campaigns + salary of people running campaigns + agency creative costs) vs. profit from incremental product sales.
Based on results of value identified for Facebook, optimize their advertising mix strategy for future product launches.
My recommendation above is the simplest way to attempt this. To rigorously prove value we could all work together to create
purer controlled experiments.
It is always so cool to run marketing campaigns in large homogenous markets (like Europe, Asia, or large chunks of the US). It is possible to get good test and control groups (type of population, existing brand awareness, market penetration, competitive structures) for our experiments. Then we can treat every campaign as an opportunity to identify causality between the money spent on advertising and the product sales achieved.
It goes without saying, this is exactly how I would prove causality if I was running social media campaigns on Twitter, Ren Ren or vKontakte.
Attending this presentation inspired me to write this blog post. The case study presented raised tough questions.
Why is it so hard to measure the value of Facebook? How can we do better? Why don't more CMOs spend millions of dollars of budget on Facebook, like they might do on AOL and Bing and Yandex?
The long flight home helped me arrive at two conclusions: We (CxOs, Marketers, Analysts) don't really understand what is unique about Facebook. (This makes me really sad.) Because we don't understand the uniqueness, we fall back on profoundly sub-optimal old world metrics like Reach or Online GRP equivalents.
We can do much better. Let's together try to fix those two problems.
The Setup/Broad Context.
Since we are interested in identifying the ROI/Economic Value of Facebook efforts, we'll assume that we are a for-profit entity who makes by selling our products and services or we are a non-profit who would like to spread the word and raise donations.
In both cases we are using Facebook to improve our bottom-line.
My hope is to start by correcting one of the foundational flaws about how we think about Marketing/Measurement and Facebook, then clearly identify two things we have to do to prove Facebook's ROI, dive really deep and identify specific ways to measure each effort we undertake on Facebook and close with a handy measurement summary along with my personal
crazy social media lessons.
Our sections are:
I would love for you to read the post in the above order. You're welcome to read a section or two, as time permits, and then come back and read the next section and so on and so forth. I did not want to take short cuts, I did not want to rush through critical concepts, hence the post is long. But if you read it, I promise, you'll see Facebook marketing, advertising and analytics in a completely new light.
Excited? Let's go!
Facebook Advertising/Marketing ROI Challenge: You're Thinking Wrong
I wanted to come up with a way to visualize the unique challenge Facebook faces when it comes to proving ROI.
I don't think it is simply a metrics/measurement problem. Metrics are a problem. But that is not all there is to it.
It is a "
what you actually do with it" problem.
In almost all other types of advertising today our purpose is simple. When you run a search ad on Baidu (or display ad on AOL or participate in AdSense or…), the objective of your advertising is (holy grail time now…): find the right person, at the right time, target them with the right message ("I beg you, please come to my site!") and get them off the advertising channel and onto your site.
You've deployed five, six or 15 web analytics tools on your website/mobile app. You can measure like crazy what happens when that advertising results in a visit.
For all other advertising, except Facebook, your "let's prove the ROI of this channel" process looks like this…
To understand advertising effectiveness you'll spend some time measuring CPMs, CPCs and, every other Wednesday, CPAs. If you are new to analytics, maybe you obsess about the wrong thing (impressions). That is ok.
But you spend almost all your time measuring bounce rates and page views and time on site and all that other ok stuff. As you mature you start measuring things that really matter,
macro and micro conversion rates,
economic value,
visitor loyalty. All the things that directly tie to the bottom-line of your company, which you can tie to
Net Income driven by digital.
As you go from maturiry to true wisdom, you add
multi-channel analytics and prove the value of digital on your offline existence (catalogs, store purchases, call centers, etc.). And then beyond, to measuring your Net Promoter Score (or the latest flavor of the month customer centric metric), etc.
You can see how it is trivial to show the value of your Bing and Baidu and AOL and Yahoo! and AdWords ads. And if you want to go beyond trivial effort, you can show offline and non-line impact.
But all this changes when it comes to Facebook.
At the most macro level we don't participate on Facebook to get people to come to our digital existence. We participate on Facebook to engage with people via our brand pages, and those people just stay with us on Facebook. Maybe some of them remember our brand name and our products (Lord knows we are pimping ourselves aggressively on those brand pages) when it is time for them to make a purchase.
Yes, you can also buy display advertising on Facebook to drive people to your site. But most of the advertising that Facebook suggests you do on Facebook is to help you get more people to Like your Facebook brand page/posts, or to break the limits placed on you by EdgeRank and reach people who already like you.
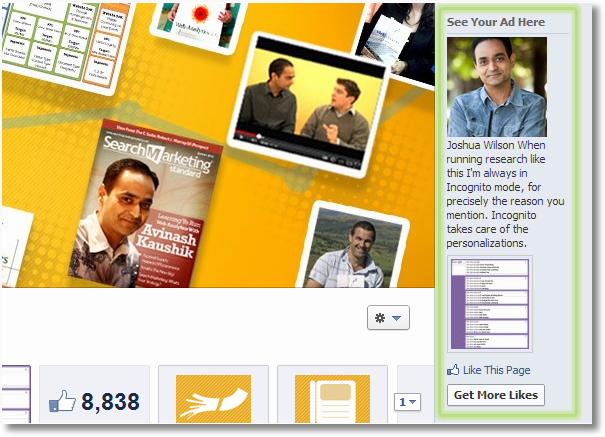
Here's a good example. Facebook is suggesting that I run an ad for my brand page using a reply I'd written in a post (a little weird to run an ad on a reply to someone else, but you can see how you could run an ad for your brand page):
You can click on Get More Likes button and proceed into Facebook's advertising system to get more likes by setting up an ad/sponsored story:
Introduce my brand to a big audience, 164 mil in the US per Facebook (though consider this number as "general guidance" and not reality), or be more targeted with my ad (and money) and target a smaller, more relevant audience by their demographics, interest categories and other dials that Facebook empowers me to leverage.
Another ad format you can use is the Promoted Posts format. I can post something on my brand page and then leverage Facebook's massive audience to get them to see my awesome post and get more of them to engage with the post (and my brand). Here's what that ad product, and set up, looks like:
For fifty bucks I can reach 14k to 26k people (based on my ad targeting options). Hopefully some of the people who already like my brand page will come to read the post and engage with me (helping me bust through the limits placed on my reach by Facebook EdgeRank), and (fingers crossed) perhaps some of their friends will see my post and Like the post or Like my brand page and maybe visit it again in the future.
By creating a Facebook brand page for your company and spending money on Facebook Advertising, as with the two ad options above, you are using your Facebook investment to:
1. Earn Likes
2. Engage an audience temporarily and, if you are good at social, engage at least a subset on a more regular basis
This is a very different from what you were doing with Bing and AOL and all the other digital advertising platforms.
You are not rushing the audience to your digital existence.
You are spending money on Facebook for an opportunity to build an audience
on Facebook for an opportunity to engage them awesomely (by not pimping yourself constantly!) for an opportunity for this audience to 1. love you and recommend you to their friends and 2. to remember to buy your products/services when they might need them.
As a deep lover of
true utility marketing, I believe in the value of doing this. I believe in the value of building an audience, rather than
renting it.
But it is absolutely critical that you understand that when you engage in any discussion about the value of being on Facebook, and spending money on Sponsored Stories or Promoted Posts, the picture (
what are you actually trying to do) has completely changed. Understanding and painting this different picture is even more critical when you talk about Facebook ROI with your executives.
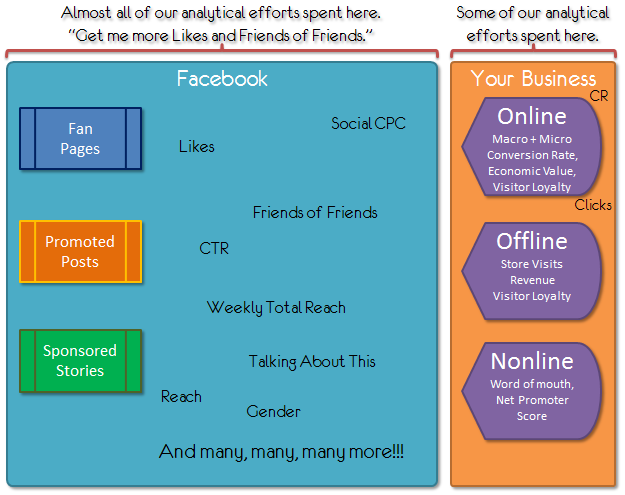
For Facebook, the "let's prove the ROI of this channel" process looks like this…
Because we are trying to build an audience on Facebook, it is unsurprising that we will spend almost all of our focus and attention on what is happening on Facebook. We will measure Likes and Friends of Friends and Total Reach (more on all these potentially sub-optimal metrics later). For our Facebook ads we will measure CPC and Social CTR and Gender and all that good stuff.
We have our business URL on our brand page (you do, don't you?), and some people will click on that URL and come to our website (desktop or mobile). A good business analyst will measure how many clicks came through from Facebook, and she/he will also measure the conversion rate, revenue, etc., from those clicks.
But since your original purpose was to create an
owned engaged audience on Facebook, rather than primarily driving direct revenue via constantly "pimping of coupons, offers," it should come as no shock to anyone that the conversion rates, revenue and bottom-line metrics from Facebook will be pretty small from the brand page efforts, from the Sponsored Stories, from the Promoted Posts. Because (sorry I'm repeating myself) that was not the point. Having a conversion business impact was not the point. And people who've tried to make it the primary point have failed miserably on Facebook.
It is very, very important to:
1. Understand this
2. Get a shared understanding with your management team of why you are on Facebook
3. Then think about how to measure ROI
All of the above will ensure that some of the, sorry, abject silliness and insane journalistic stories written about Facebook's lack of ROI will die.
There is one exception to all of the above.
Facebook and Direct Response/Traditional Advertising
There are some ad formats on Facebook where you are simply advertising on Facebook just as you might using DoubleClick or Yahoo! or Google Display Network. There is an audience out there — 950 million strong!. Let's show them ads, let's get them to come to our site.
Cut out the whole "let's send them to our brand page or get them to like a post and maybe in the future they'll buy something, maybe."
A good example of this is the kind of ad you can run to drive people to your website:
The challenge to overcome, as it often is with display advertising, is that people are on Facebook to Friend and share pictures and engage with Sarah Palin (and your business). The ads are tangential, at best, to these purposes and hence the click-through rates are pretty low. People end up developing banner blindness (which happens on all display channels).
But it is an option.
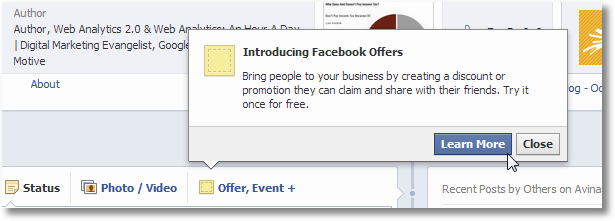
Another option is the new (at least to me, see below) Facebook Offers ad product:
This is traditional advertising: Create an offer. Show it to people. Drive them to your online or offline existence.
For both of these ad formats you can forget about what Facebook is really good at. Forget about audience building. Forget about engagement. Forget about utility marketing. Forget about that big aqua colored box in the above "FB is different" graphic.
Focus just on this big orange box.
You can measure CTR, CPC, Bounce Rates (yes even in the real world :), Time on Site, Conversion Rate, Average Order Value.
And present these to your Senior Leaders to judge success. Easy peasy.
But, as I said,
this is not what makes Facebook unique.
Let's go measure the ROI/Value of Facebook on our business doing what Facebook is really good at.
Facebook's Business Value: Two Critical Elements
To convince CMOs and CEOs that Facebook delivers value, you need to prove two things.
1. The activity you generate on Facebook is valuable.
In some cases this is easy, because the CxO does not quite understand the ecosystem and is happy to allocate some budget to Facebook because
everyone's doing it. It's a start, but you won't get very far.
The
prove value scope here is: Likes. Brand Awareness/Word of Mouth. Engagement. Or to use my metrics:
Conversation Rate. Amplification Rate. Applause Rate.
This helps you sell the value of Facebook to your business as a new
owned platform you've created. Frame it as that.
[And it will not hurt to add that when CxOs fund Print, TV, Billboards: 1. It is extremely unclear how to measure success and 2. Unlike what happens on Facebook, there is ZERO engagement/longer term value delivered, you are, at best, renting an audience.]
An additional
prove value scope can also be: Cost savings.
The number of PR people you can now fire because your Facebook page is such an awesome PR platform – not. The reduction in customer service costs – no more phone calls! The reduced TV ads you have to run. Et cetera. Harder to prove, but if you try you can.
This helps you sell the value of Facebook to those execs who are a little suspicious of this
whole social thing, and that it can actually save some money. So, tie it to the bottom-line.
So far, for most companies, it is very hard to show the value of Facebook all by itself (from Brand, Likes etc., and cost savings) — mostly because the execs can't make the leap required to see the longer term potential.
2. The activity you generate on Facebook delivers business value, online or offline, and helps produce profits.
The
prove value scope here is: Visitors to your website. Revenue per Facebook-referred visitor (staying with last click
attribution for now). Number of qualified leads. Total number of donations. Number of downloads of our latest mobile app from Facebook visitors. Amount of Cereal/Soda/Pizza/Phones/Shirts sold at Walmart/Target/Sainsburys/Watsons because of Facebook.
I would go out on a limb and say that there is no CxO in the world who would not understand the value of Facebook if you can show any of the above. Even if they don't understand the short or long term potential of the social web revolution.
When you set out to prove value of Facebook, your job is to understand that the reasons for investing in Facebook are very different from the reasons for investing in Bing or Baidu or AOL, and your job is to prove the two things listed above (value of activity on Facebook, value of activity on Facebook on your business).
Proving the Value/ROI of Investment in Facebook.
Let's take off our clothes and jump into the cold unforgiving data waters and talk metrics.
If you strip everything away, as designed, Facebook is a quest for Likes. It is what you are asked to hunt for at every turn by Facebook and Social Media Gurus. Yet in the end, Likes matter lesser than less. What matters is:
1. Do all those Likes cause any activity of value on your Facebook presence?
2. (Most importantly) Do all these Likes cause activity of value to your actual business (beyond your Facebook presence)?
For each Facebook effort, we are going to look at #1 or #2 or both depending on what we are trying to accomplish.
Facebook Brand Pages
Without brand pages you can't do anything on Facebook. Create a brand page. If you are looking for inspiration … my absolute favorite small business example is
Seventh Generation. I can't think of even one other business that understands its Facebook audience as well as they do. I can't think of anyone else that delivers the perfect balance of pimping (very little) and life value to the audience. If you want a big business example,
BMW is a good one. Most big companies stink on Facebook because they don't understand what Seventh Generation does. Or maybe big companies are incapable of being selfless (focus on the fan and not themselves) or authentic.
What can you measure to show value: Do. Not. Measure. Likes.
I will personally hate you.
Too strong?
Declaring success based on measuring Likes in aggregate is like declaring success after getting a lot of Visits to your site. SO WHAT? Likes are actually lamer. Because once I press Like I might never come back, never read anything you write, never ever engage with you, not even remember you exist.
Total Likes show potential audience. But nothing more. Don't be lame and measure Total Likes.
[We are going to deploy the measurement of Likes at a tactical level in this post to gain a
oh here's a small way to understand value perspective. But not, ever, in aggregate.]
You want to answer the "
so what question," so you have to look beyond the obvious. You want to know what is happening after you created the brand page, and some people liked it.
Here's what Facebook provides you with:
Likes tells you potential audience (nothing else). Friends of Fans gives the size of your second level network (almost 100% useless). People Talking About This is a compound metric –
they are usually non-insightful – that kinda of sorta tells you that one of seven things might have happened, but not which ones (kind of interesting, but not in this form). Weekly Total Reach shows the impressions of your Facebook ad/post/things (kind of interesting – think TV GRPs). Total Subscribers is what it says, for your page (not sure if this is anything).
Nothing here to answer the "so what" question.
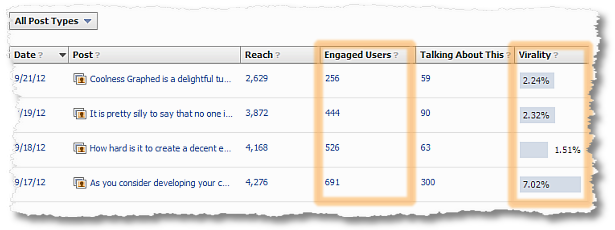
There is some more data you can get on Facebook if you scroll to the post level view:
Reach, meh. Engaged Users sounds really interesting as it purports to show actual real human interactions (FB definition: "Engaged Users is the number of people who have clicked anywhere on your post."). TAT is meh because it is a compound metric. Virality also sounds really interesting (FB definition: "Virality is the number of people who have created a story from your post as a percentage of the number of people who have seen it. This is a great indicator of the kind of posts your audience responds to.")
[Update: As Jeff and Daniel have pointed out in comments below, both Engaged Users and Virality, interesting as they sound, are sourced from our Reach and TAT metrics! We will address is below.]
The reason most executives don't perceive the value of Facebook is because of how Facebook has defined success. From the "sexy names" of the metric it is very hard to figure out what they are actually measuring, and, most importantly, none of the provided metrics seem to answer the "so what" question at all. This really hurts Facebook.
I believe metrics should measure only one thing to ensure everyone knows exactly what is being measured (hence no
compound metrics). They should go beyond measure "impressions," they should measure "clicks." In other words, they should measure outcomes.
Here are three metrics I like, for all social channels (from my
best social media metrics post):
1. Conversation Rate: # of Audience Comments (or Replies) Per Post
2. Amplification Rate: # of Shares Per Facebook Post
3. Applause Rate: # of Likes Per Facebook Post
These three clean metrics answer these questions clearly: When we post on Facebook does anyone actually engage with us via typing on their keyboards and adding to the discussion? When we post on Facebook does anyone amplify our contribution so that it is seen by people who don't know about us? When we post on Facebook, which content is loved by our followers/fans/friends (so that we can kill the loser stuff)?
The data for all three is in the metrics Facebook provides. Unfortunately it is
blended and hard to get to recognize/analyze.
Take for example Talking About You. Here's the official definition: The number of unique people who have created a story about your Page during your selected date range. A story is created when someone: Likes your Page; Likes, comments on, or shares your Page post; Answers a question you've asked; Responds to your event; Mentions your Page; Tags your Page in a photo; Checks into or recommends your Place.
I dare you to analyze which one of those things is happening more or less, or working better or worse, when you see 699 in your report.
So keep things clean.
For your Facebook brand page at an aggregate level, measure Conversation, Amplification and Applause.
You can use any tool you want to measure this; I use
TrueSocialMetrics…
You'll measure the trends over time and you'll be able to show your management team that you have a trillion Likes, you have managed to have a conversation with 5 people on average per post (not "People Talking About" of 699), your post has been shared x times each and you are going to focus on high-applause posts. [Rather than being an end in themselves, Likes here are 1. active and 2. used to identify high-value content via user behavior.]
Sweet, right? You know the "so what," it is clean, you know what to fix, and you know whether those aggregate Likes are adding up to specific engagement.
Time to dive deeper.
At an individual post level, if you are using the data in Facebook Insights, measure Engaged Users and Virality to optimize your Facebook brand page engagement/value.
These two lovely metrics from Facebook empower you with diagnostic capabilities to understand why your Conversation, Amplification and Applause Rates might not be where you want them to be, and to figure out which Facebook brand page contributions are better or worse.
Clearly, looking at the above data, I should do more of what I did on Sept 17th!
[Update:]
If you step away from Facebook Insights then you can do better, at a Post level, and measure the metrics that really matter. Facebook kindly provides a Export Data button in its Insights reports. Click it. From Select Data Type choose Pot Level Data.
In the spreadsheet look for the tab called "Lifetime Post Stories by act…" If you squish the columns you'll find something delicious, columns titled "like," "share," and "comment." Now you have the capability to measure the exact same metrics we use at Page level, but now you can do so at a Page level.

This helps us achieve a clear line of site between measuring Page and Post level value delivered by us, and what kind of engagement we are getting in exchange. Over time as you look at these metrics you'll know 1. what posts are perceived to be of value 2. what type of posts people help you spread around more and 3. what type of posts drive conversations (!).
Simple metrics help you focus on what's important and answer the "so what" question for your Facebook brand page:
Conversation | Amplification | Applause | At a Page and Post level
How can you magically report all of them together? I don't know. But I'm happy you can't data puke and you have to go find this data and look at it. That promotes analysis. :)
Important Note 1: In this section we've measured the
active engagement that is created from your brand page. Not everyone who reads your content will
actively engage with it. Some might choose to
passively engage with it. They come. They read. They do nothing with you on Facebook. This does not mean their visiting your page, or just reading the content was valueless. They might have been impressed, they might buy your products. We just don't know. They are the classic
unknown unknowns. If you want to learn more about this
passive engagement, and how hairy this can actually get, please ready my good friend Thomas Baekdal's wonderful post:
Facebook Insights: Debunking Friends of Fans.
Important Note 2: Your Facebook brand page, in addition to the above engagement, will produce some sales, even if you don't try. :) How do you measure that? Please see the Analytics custom report in the FB (Display) Ads section below. That is how!
Facebook Promoted Posts
With Promoted Posts you are simply trying to 1. Bust out of the Facebook EdgeRank limitations to reach more people who already like you and/or 2. Reach the friends of the people who already Like you (think Amplification).
You pay money. You get more exposure. You can get more Likes for the post (directly in the news feed). You can get more Shares. You can get more Comments on your post. Maybe you can get more Likes on your brand page.
So what can you measure?
First go into your Facebook Ads Reports, then Facebook Campaigns, click on Reports, choose Advertising Performance as the Type, and select your promoted posts.
You have a raft of metrics available. Focus on Clicks, CPC and Budget. How much did you spend and what did you get for it? (This is easier if you go into Facebook Campaigns and click on the pencil next to the campaign and give cleaner names to your promoted posts campaigns.)
Then drill down to look at each individual promoted post’s performance.
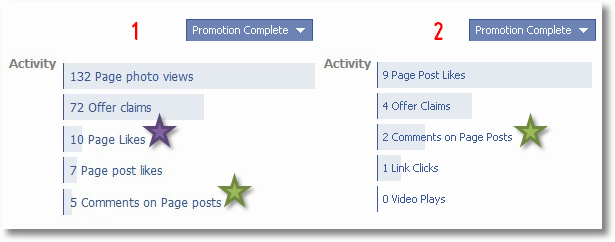
When your promotion is complete, you can see Budget Spent and Paid Reach. Compare and contrast across posts.
You can also see activity: Page Post Likes, Comments on Page Posts, Link Clicks and Video Plays (both if relevant). And you can compare it across posts you have Promoted…
You can get contextual information on Paid Reach. Just hover over People Reached and you'll see your Organic (constrained by EdgeRank), Viral (Shares by others) and Paid…
The number you are looking for is 221 (Paid). You'll notice the numbers above do not add up to 440, that is simply because some people might have seen the post via multiple methods (so I got it first just organically, EdgeRank did not limit it, and then I saw it again when you paid for it).
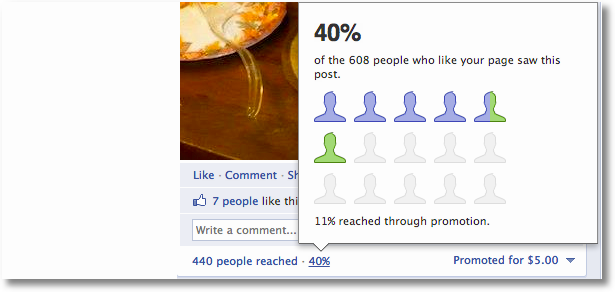
You can see another cool visual by hovering on the percentage number:
It shows you how many impressions of your Promoted Posts were shown in people's news feeds. It is cute.
From the data Facebook provides for Promoted posts if you prioritize these metrics, it will help you optimally determine impact of your spend in terms of value added to your Facebook brand page:
Budget | Paid Reach | "$ per Incremental Reach" (Budget/Paid Reach) | Incremental Likes | Comments
You are able to show how much money you spent, the cost of reaching an additional audience, the results in terms of engagement (incremental likes and comments).
In terms of optimization, at the very minimum focus on $ per Incremental Reach. Experiment with Facebook targeting options and over time reduce $ per IR while delivering incremental Likes and Comments at the same or higher level.
While you are able to show some value added to your Facebook brand page, the challenge with Promoted Posts is that the "so what" is extremely unclear.
So more people saw my post, some of them even liked and commented on it.
So what? The connection between you writing a post to you promoting it to possibly getting a new audience to them engaging to them going to your site/physical store to them buying something is fragile. I was going to say unclear, but let's stick with fragile.
You can frame it as "we are making our Facebook brand page more valuable by getting an incremental audience." And tie it to the stuff we did above for brand pages, to create an
owned audience on Facebook.
Request for Facebook: Clustering & Segmentation
What would be ideal is to maybe pull all the new Likes collected via Promoted Posts to be identifiable in a unique way (just like conversions we got from Bing or Email marketing). Likes we might not have received if we had not spent money on Facebook advertising.
Then over time we could measure these people (
segmentation!) to see if they were of value. Did these people, we acquired at a cost, have a higher Conversation Rate or Amplification Rate or Applause Rate?
If they don't have higher rates, or even the same rates, then we are acquiring a sub optimal audience and we should stop spending money on Facebook. Or they have the same or higher rates, let's give Facebook unlimited budget.
Facebook Sponsored Stories
Here is the simplest explanation of sponsored stories from
Facebook's help page:
"If someone likes your Page they are saying they are interested in being connected to you and it can be interpreted as an endorsement of your brand or service. People may see when their friends like your Page, but because there is a lot of activity in news feed, they may miss it. When you create sponsored stories, you’re increasing the number of people who will learn about you through the actions of their friends."
Interpretation? When people like you or talk about your brand, you can take that, package it into an endorsement and show it to other people. I write a post about Cafepress being great. You can pay to get that packaged into an ad that will be shown to my friend.
What is the purpose? Earn more Likes, be introduced to a potentially new audience.
Best metrics to show value?
Budget | Paid Reach | "$ per Incremental Reach" (Budget/Paid Reach) | Incremental Likes | Comments (or your preference for engagement).
Aggregate impact on your Facebook brand page? Hard to identify.
We can't identify the long term impact of spending money on Sponsored Stories (
helpful pdf) because of the same challenge above, no clustering/segmentation is possible.
Cafepress could get a million new Likes because they sponsored a story about a post I'd written about them, but there is no way for Cafepress to know if the audience they acquired (my friends/fans) are worth anything in the short or the long term. It is extremely difficult to know if the million new Likes delivered a valuable audience, increased engagement on the Facebook brand page, or, over the long term, this audience placed more orders on Cafepress.com.
Simple controlled experiments could possibly help us get a slightly enhanced understanding of the impact.
If other variables can be controlled, you can run sponsored stories a bunch of times (weeks, a month) and measure your overall Conversation, Amplification, Applause rates and your individual post Engagement and Virality. Then for the next month, don't do any sponsored stories. Repeat the same measurement. See if sponsored stories add any value.
This assumes you can keep the posting quality the same, and you don't have any extraneous circumstances were you are suddenly showered by a massive number of Likes due to an external campaign.
Like I said, hard to identify. But that does not mean you can't try.
Business bottom-line impact of sponsored stories? Unclear. See relevant section above in promoted posts.
 Facebook (Display) Ads
I'm using the word display simply to clarify that these ads will be very similar to those that might run on any other ad platform, and the purpose would be the same (get people to our mobile/desktop websites).
You can see one such ad on the right. I'm targeting 14 million people who are in the US (again the 14m is "general guidance," you'll rarely come even remotely close), who are in a relationship, married or engaged :), who are in tech or business categories. My ad, unsurprisingly, extols the glory of my blog and promises riches and fame, as all ads should.
(Is it not cute that my ad says: You like Avinash Kaushik. :)
How do we measure success?
To measure real success you HAVE TO make sure that all your ads are tagged with campaign parameters. The url in my ad is not:
www.kaushik.net/avinash
It is:
www.kaushik.net/avinash?utm_source=social-media&utm_medium=Facebook& utm_campaign=thomasb
Without this you are going to cry later. A lot.
If you use SiteCatalyst or WebTrends or CoreMetrics, use their campaign parameters.
Ok, how do we measure success?
Facebook will give you a raft of metrics. From Facebook's collection I'm fond of these: Click-thru Rate, Social Click-thru Rate (to see if socially annotated ads are better), Cost Per Click.
You can't really do CPA with Facebook, else I would have it there (for CxOs FB should consider doing conversion tracking). I'm not a fan of impressions, so I ignore things like CPM, etc.
Time to do the analysis that actually matters to your executives, measuring outcomes!
If you'd used campaign tracking parameters then it is trivial to create a simple
custom report that would show you the deep view of Facebook campaign performance…
Can you show the impact of your Facebook Advertising on your business bottom-line?
Yes! Yes, sweet nectar of a lotus, yes!
You can measure the number of people that showed up. You can measure if they were new or you already knew them. You can measure their micro and macro conversions, and how much money you made per visit.
Bonus: You can compare the performance across your Google+ and Twitter campaigns, and smile because you, dear reader, are doing very well on Facebook in terms of outcomes (now just find more relevant people to show ads to in that 950 million pile on FB!).
Unlike AdWords you can't merge your Facebook advertising data with your onsite analytics data in Google Analytics. You'll have to do that manually. But in the final summary you'll measure your Facebook (Display) Ads using a report that shows:
Click-thru Rate | Social Click-thru Rate | Cost per Click | Visits | Unique Visitors | New Visits | Micro Conversions | Macro Conversions | Per Visit Goal Value
You can replace the last one with Revenue or Average Order Value if you are hard core ecommerce.
Facebook Advertising's Offline Impact
This part is super complicated for Facebook because of everything you learned in the second part of this post. But we all know that this is a challenge that all digital advertising faces. We have to prove the value of Google and AOL and Yandex and everything else on our big business offline existence.
In case of Facebook, as outlined at the start in the story of Brand S,
controlled experiments are our BFF.
Here's how this will unfold inside your company:
Question from CEO: Can I drive people to buy more Pepsi at Wal-Mart by running a bunch of Promoted Posts, Sponsored Stories AND Facebook Display Ads.
You: Hmm… I don't know. Wait, let me check Occam's Razor.
Few minutes pass.
You: Yes we can! I'm going to pick 25 cities in the US. I'll bombard users in those cities with Facebook Ads. They'll come to our brand page, love it, and comment on it and we'll reply to them, talk about new Pepsi Min, etc. Then after two weeks I'll get my sales data for the Wal-Marts in my 25 cities and compare the sales for Pepsi Min, and see if there is a statistically significant lift in sales when compared to other cities I did not bombard with Facebook ads.
CEO: OMG, you are so clever. Go do that. And come back and tell me Facebook works!
It is a little harder than that. You do need people (/one person) inside your company with skills in the Scientific Method, Design of Experiments and Statistical Analysis. And you'll need cooperation from your offline existence (Wal-Mart in this case).
But it is doable, if you really want to prove the value of Facebook.
In addition to the above scenario, you can use Primary Market Research to isolate the impact of your active Facebook participation in creating incremental lift in your
likelihood to recommend our brand or Net Promoter Score, or in your brand perception, or a strong signal in brand recall studies, or… other qualitative metrics.
You would need a large enough study and a large enough number of people who Like you on Facebook and a smart researcher.
But it is doable, if you are committed.
The bottom-line, a bit more severe for Facebook than for Bing or Yahoo! or other digital platforms, is that Facebook is going to have to prove this type of an impact in the long run because of this…
When we are on Facebook we are trying to create that big aqua box, our own
owned audience. For a small part of that we will show the orange impact. For most of it we are going to have to work hard and prove that an
owned audience is monetizable and delivers business value. It is straightforward with Facebook (Display) Ads, but
they do poorly. So for all other stuff, because the aqua is big and not the orange, we are going to have to solve this problem.
If we don't, we will have a hard time showing long-term sustained value from Facebook (or Twitter or the Google+ website).
Facebook prove the value to me Summary
This is an incredibly complex space, and there are so many insights and recommendations. It is hard to summarize all that into one handy dandy view. But I'll be remiss if I do not give it a try.
Here's a simple view of what it takes to measure the return on investment and business value of Facebook:
Click on the image for a
higher resolution version.
I hope you find the summary to be of value. If you use other metrics, or find flaws above, please share them via comments.
Closing Thoughts: Two Crazy Social Media Lessons
1. Don't have a social strategy: create products and services that compel social activity.
At the end of the day, it is important to remember that the Facebook engagement you create, the amount of traffic you can get from Facebook (to your online or offline presence) will rarely match the engagement, reach and outcomes that people who love your products will create for you.
So yes, focus on having a great Facebook presence and buy ads on Facebook, but remember to make your products and services so amazing that people can't help talk about them on Facebook. The impact of this organic (free!) activity will blow your mind.
Ultimately social is not just about how social your company is. It is about how many social ripples your products/services create.
Don't believe me? Just ask Apple. :)
2. Social media success does not guarantee, business success.
Dippin' Dots crossed five million Facebook Fans a couple of days before they filed for bankruptcy in Nov 2011. (They were recently rescued from bankruptcy, no not by their Facebook fans. :)).
Pepsi is one of the most active social media participants, including on Facebook. Yet year over year they've continued to lose market share to Coke.
The examples are numerous.
In the end, business success (amazing products and services) can be hugely amplified by social media. Social media success can rarely make up for core problems with your business / business strategy / products and services.
Please keep these two humble lessons in mind.
I'm a big huge insane fan of this amazing evolution in how we influence people. I can't wait for the era of non-contextually shouting on TV/Radio/Magazines to die. I can't wait for irrelevant badly targeted interruptive advertising to die. Our ability to reach the right person at the right moment with the right message is turbocharged by a combination of social and mobile. That makes me so happy. I'm deeply excited about utility marketing, again powered by social and mobile.
I hope you see this post as a pragmatic way to look at optimal Facebook participation, and a real world practical guide to measuring the value of Facebook to your company. If you use the recommendations in this post to show reality today, learn your lessons, go back and optimize your Facebook strategy and drive more business value, you'll accelerate your company's ability to move from the past (shout marketing) to the future (conversation marketing).
Insights and recommendations in this post apply almost 100% to Twitter, Google+, Pinterest and the next social network the press deems the new "Facebook killer!"
Thank you for reading.
As always, it is your turn now.
Do you get asked to prove Facebook's value? What strategies do you use that have worked for your company/agency? Have you figured out a clever way to measure impact of Facebook on your digital existence or your real world existence? Anything short of controlled experiments? Are you as wary of Likes and Impressions as I am? Oh and do you think I should abandon my
pollyannaish world view and just give in to metrics like Reach and Online GRPs to get more budgets shifted to digital?
I welcome your critique, brilliant ideas, wry observations, and delightful comments.
Thank you.
Facebook Advertising / Marketing: Best Metrics, ROI, Business Value is a post from:
Occam's Razor by Avinash Kaushik



 Facebook has an incredible audience, 950 million strong and counting. This audience is immensely attractive to Brands and Marketers around the world. We've seen explosive growth in brand pages, types of advertising and other fun ways to monetize this audience.











 Facebook (Display) Ads

